Local Feature Importance
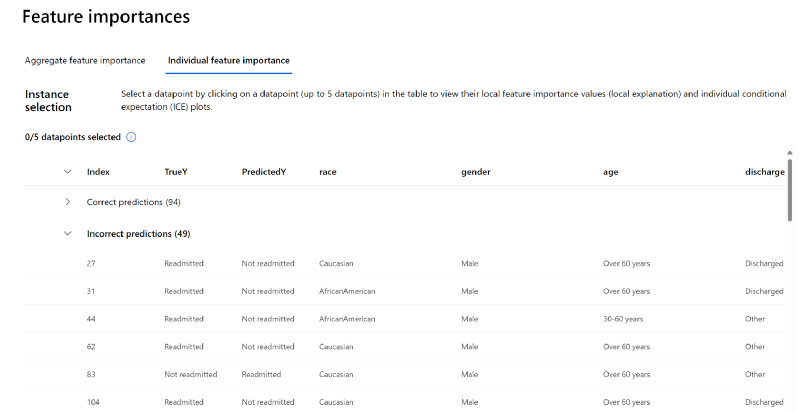
The RAI dashboard Feature Importance component has a table view that enables users to see which records the model made a correct vs incorrect prediction. You can use each individual patient's record to see which features positively or negatively drove the model outcome for that individual. This is especially useful when debugging to see why the model's prediction is incorrect for a specific patient, and which features are positive or negative contributors. In our case, you'll focus on the cohort with the highest errors.

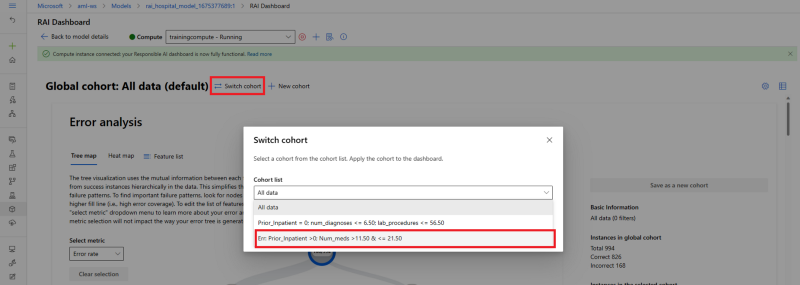
- Click on the "switch cohort" link on top of the dashboard. Then select the "Err: Prior_Inpatient >0; Num_meds >11.50 & <= 21.50" cohort under the "Cohort list" drop-down menu list.

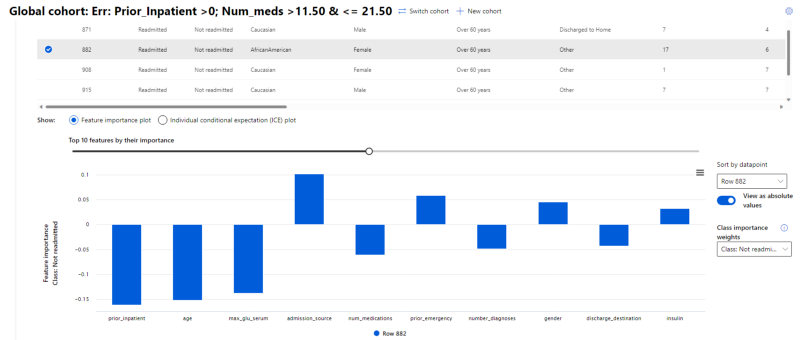
- Under the "Incorrect predictions" table view, select record index #882. This will generate a Feature Important plot chart under the Table view.

- Here you will see that "Prior_Inpatient", "Age", "Max_Glu_Serum" and "num_medications" are the top 4 features that are negative contributors to driving our model incorrectly predicting that the selected patient will not be readmitted within 30 days (outcome should be Readmitted).
- Confirm that the 4 features from record index #882 are different from the top 4 features we saw above driving the models’ overall predictions from the Aggregate feature importance tab.
- Next, the Individual feature importance graph shows that the "Admission_source", "prior_emergency", "gender" and "insulin" positively contributed to the model's outcome (Not Readmitted). Since the model incorrectly predicted record index #882 as Not Readmitted, that means the positively contributing features are erroneous: "Admission_source", "prior_emergency", "gender" and "insulin" since they played a significant role in skewing the model's output for this data point.
As you can see, in trying to debug why a model’s prediction is erroneous for a given data point, this chart provides ML professionals an explanation of which features positively influenced the poor outcome.
Individual conditional expectation (using ICE plot)#
The RAI dashboard gives you the ability to select a feature and see the model's prediction for the different values in that feature using the Individual Conditional Expectation (ICE) plot. We'll use the same patients above: record index #882 and #865. In addition, we'll use the "A1CResult" feature to see the models prediction for its different values.
- Select the "Individual Conditional Expectation (ICE) plot" radio button.
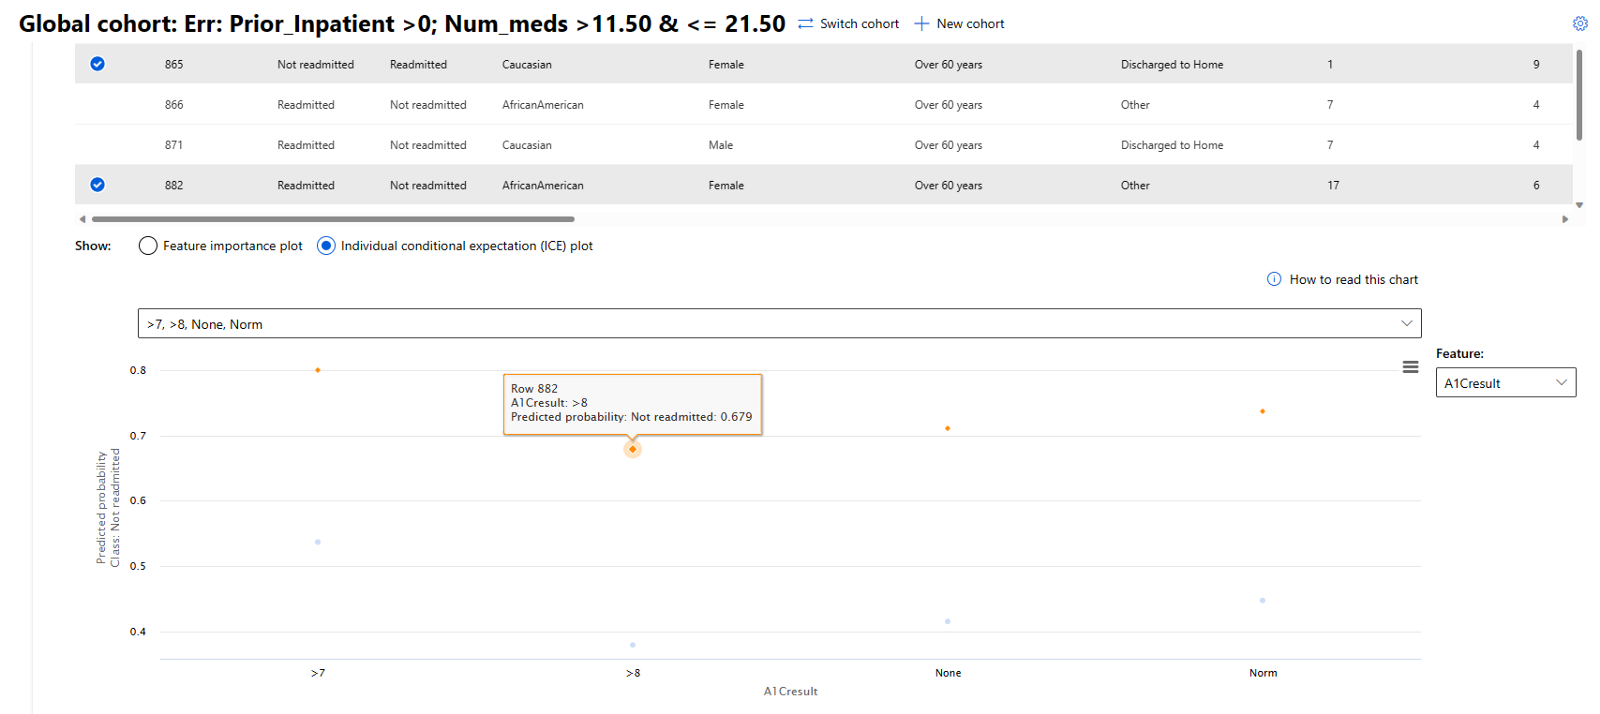
- Next, in the Feature drop-down menu, we'll select "A1CResult". The orange dots represent record index #882 that the model incorrectly predicted as Not Readmitted. The blue dots represent record index #865 that the model incorrectly predicted as Readmitted.

- Under The ICE plot, you'll see the model's predictions for the different "A1CResult" values: "Norm", ">7", ">8" and "None" (the "None" when no A1C test).
- As you can see from the chart, a patient has the lowest chance of not being readmitted when the "A1CResult" result is ">8" for record index #882 and #865. Both the orange and blue dots are showing the lowest point in their cluster at the ">8" mark on the axis, and the model's predicted probability of not readmitted is showing a low probability for both dots at the axis. This makes sense because an A1C result greater than 8 is considered a very high level and is serious for diabetic patients. Hence, the need to be Readmitted in combination with other factors. As you can see, this is a good way to see how a feature's value has impact on a model's prediction.
This lab shows how the Feature Importance removes the black box way of not knowing how the model went about making a prediction. It’s a global understanding of what key features the model uses to make a prediction. In addition, for each feature the user has the ability to explore and visualize how it is positively or negatively influencing the model’s prediction for one class vs another for each value in the feature. This exposes the thresholds the model has to produce a certain outcome. We saw this in the “Number_Diagnoses” feature.
Shutdown#
Be sure to shutdown your compute instance.