Find model errors
We rely on traditional model performance to give us the overall "accuracy" of a model. However, we fail to realize that there are areas in the data where the model performs very poorly. The Error Analysis section of the RAI dashboard helps provide an error distribution of the feature groups contributing to the error rate of the model. Errors are often not distributed evenly across different data subgroups and Error Analysis helps you identify features with the highest error rates.
In this lab, we are going to explore how to use Error Analysis to find errors in the trained model to identify where the errors are. In addition, we’ll learn how to create cohorts of data to investigate why a model is performing poorly in some cohorts and not in others.
Identify and create a cohort for the tree path with the highest errors#
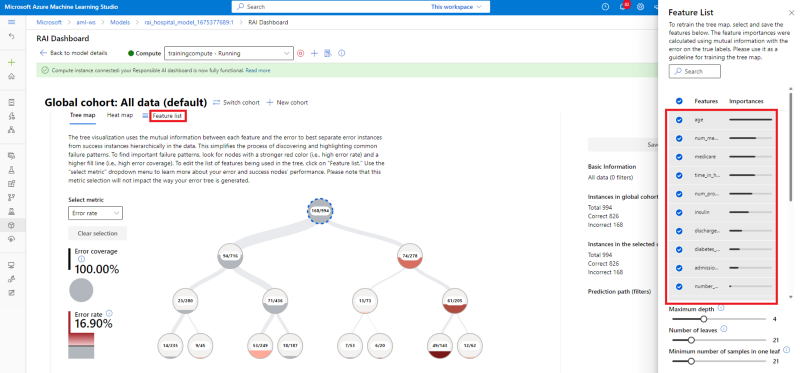
To start the analysis, you can observe that the root node shows that out of 994 total test data, 168 incorrect predictions were found while evaluating the model.

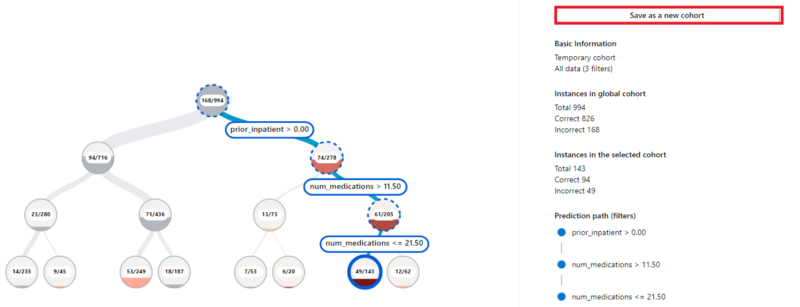
When trying to find error affecting the model's performance, the first thing to do is find the tree path with the highest error rate. The shade of red shows what percentage of this node’s datapoints are receiving erroneous predictions. The darker the red the higher the error rate. In our case the tree path with the darkest red color has a leaf-node num_medications ≤ 21.50 on the bottom right-hand side of the tree.
To select the path leading up to the node, double-click on the leaf node. This highlights the path and displays the feature condition for each node in the path.
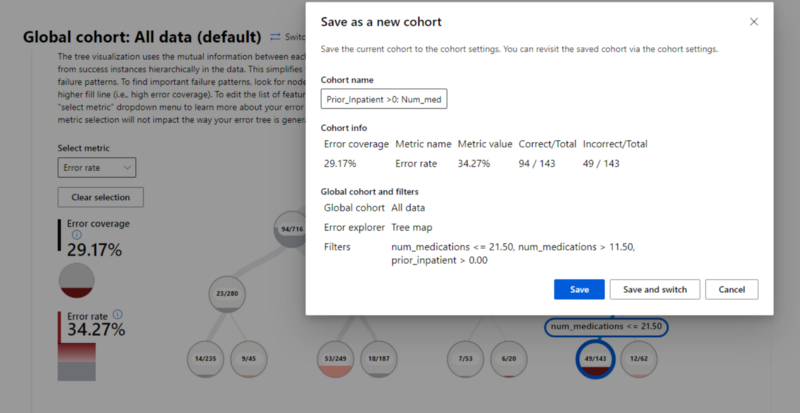
Create a cohort out of the selected path by clicking on the “Save as a new cohort” button on the upper right-hand side of the Error Analysis section.

Note: The dashboard displays the “Filters” in this selection: num_medications <= 21.50, num_medications > 11.50, prior_inpatient > 0.00.
- Name the cohort: Err: Prior_Inpatient >0; Num_meds >11.50 & <= 21.50

Identify and create a cohort for the tree path with the least errors#
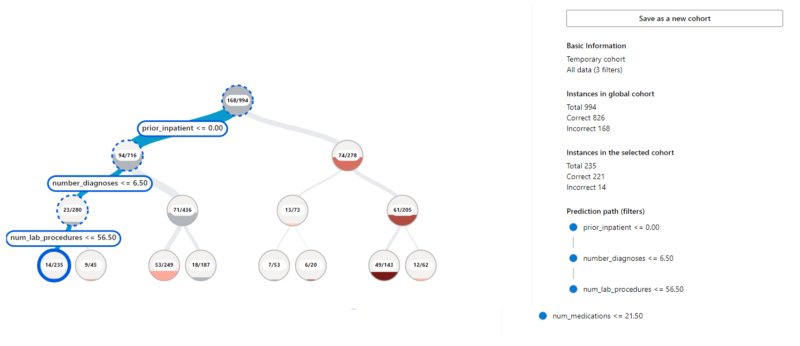
For contrast purposes, create another cohort with the tree path with the least number of errors to see if we can gain insights as to why the model perform well in one cohort vs another. The leaf node with the feature condition num_lab_procedures ≤ 56.50, on the far left-hand side of the tree, is the path of the tree with the least errors.

- Double-click on the node and save the selected path in a cohort. The "Filter" in this dataset is: num_lab_procedures <= 56.50, number_diagnoses <= 6.50, prior_inpatient <= 0.00.
- Name the cohort: Prior_Inpatient = 0; num_diagnoses <= 6.50; lab_procedures <= 56.50
Use the Feature List to identify the top feature contributing to model errors#
One of the advantages of using RAI dashboard to debug a model is that it provides the "Feature List" pane, which is a list of features in the test dataset that are error contributors. The list is sorted based on contribution of the features to the errors. The higher a feature is on this list, the higher its contribution importance to your model errors.

In our Diabetes Hospital Readmission model, the "Feature List" indicates the following features to be among the top contributors of the model's errors:
- Age
- num_medications
- medicare
- time_in_hospital
- num_procedures
- insulin
- discharge_destination