Find errors using Heat map
From the Feature List, "Age" was one of the top error contributors. So, we'll use the Heat map tab to explore which age group of the patients are driving the model to perform poorly.
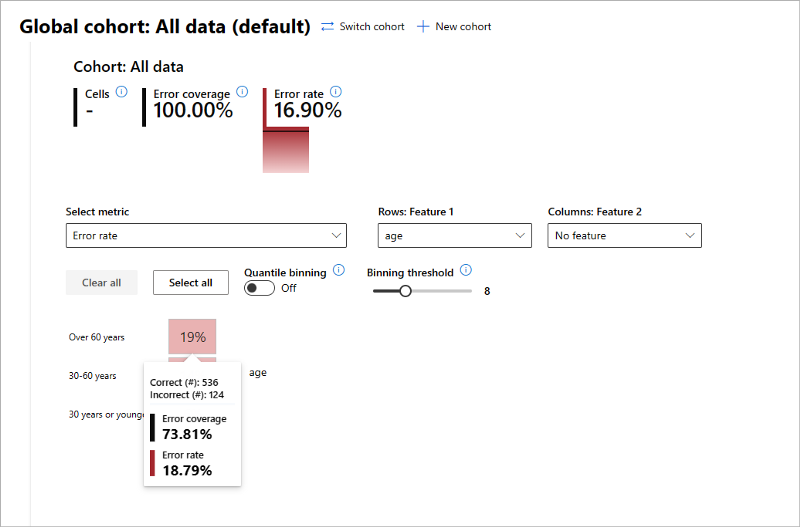
- Under the Heat Map tab, select "Age" in the "Rows: Feature 1" drop-down menu to see what factor it plays in the model's errors. After selecting the "Age", we can see how the dashboard has a built-in intelligence to divide the feature into different cells with the possible conditions (e.g., "Over 60 years", "30–60 years" or "30 years or younger").

Hover your mouse over each cell, you can see the number of correct vs incorrect predictions, error coverage and error rate for the data group represented in the cell.
Observe how the cell with "Over 60 years" has 536 correct and 126 incorrect model predictions. The error coverage is 73.81%, and error rate 18.79%. This means that out of 168 total incorrect predictions that the model made from the test data, 126 of the incorrect predictions came from "Age==Over 60 years". Even though the error rate of 18.79% is low, an error coverage of 73.81% is a huge number. That means a majority of the model's inaccuracies come from data where patients are older than 60 years old. This is problematic.

- The cell with "30–60 years" has 273 correct and 25 incorrect model predictions. The error coverage is 25.60%, and error rate 13.61%. Even though, the patients with "Age" equal to 30–60 years" have a very low error rate, the error coverage of 25.60% is a quarter of all the model's error, which is an issue.
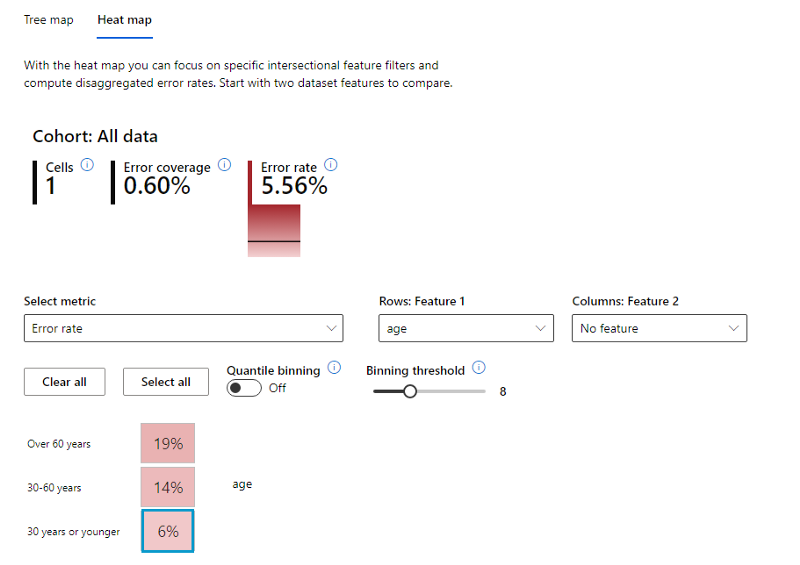
- The cell with "30 years or younger" has 17 correct and 1 incorrect model predictions. The error coverage is 0.60%, and error rate 5.56%. Only having 1 incorrect model prediction is insignificant. Plus, both the error coverage and error rate are low. It's safe to say the model is performing very well in this cohort, however we have to also consider that its total data size of 18 is a very small sample size.
The observation shows that Age plays a significant role in the model's erroneous predictions. Similar to the Tree map, you can create cohorts for each age groups for further analysis.
We've learned that Error Analysis component of the RAI dashboard provides multiple avenues of identifying features causing a model to be erroneous: Tree map, Feature List, and Heat map.